
Lesson 8: How much does "Long-term" COVID-19 impact one's usual activity level?
Question 42 of our questionnaire addresses that. Here's how the question was phrased:

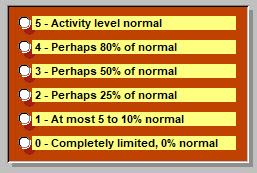
And the point of reference was at the time of taking the questionnaire. At that point, most respondents had been ill about 6.5 months. Possible answers were:

Level of activity of course depends on how sick one is. One can readily imagine a person with a cold, moving through his day, blowing his nose and complaining about how he feels. (While spreading around his cold). But with an activity level perhaps not too abnormal. That's just an example.
Already presented elsewhere, here is a reminder about illness severity, the responses to Question 28:

A bit hard to read, but 79% (of 100 respondents as of 7 October) placed this as a moderate illness, "very sick, many symptoms, lasted longer than anticipated." So no, not a cold.
But how much did this physically limit those affected?
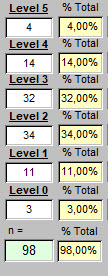
Here, in the column at right, are the answers obtained:
As frequently happens, some questionnaires (2 in this case) were omitted because of too many inconsistencies in dates or ommissions of information (like gender, DOB, etc). So 100 responses became, n = 98. The column with percentages at right is based on the total of 100 nevertheless. The distribution of responses from highest to lowest seems pretty "normal" which has a specific meaning for subsequent statistical analysis.
These results permit calculation of a mean or average value, which looked like this on this date.
On the left below, the mean and standard deviation (amount of variability around that mean value).

As one can see, by translating that into a percentage of the highest score possible (5) we learn that this illness in its "long-term" variant, cuts usual physical activity essentially in half.
"... how physically limited do you find yourself?" was being asked: and the answer is clear.
Some people are usually more physically active than others of course. And does this illness affect differently what we can identify as subgroups of this larger group of 98 on this day?
What about effects of age? What about gender differences? How about habits one had before becoming ill, such as smoking or taking nutritional supplements? What about one's size: Underweight? Overweight? Obese? We'll look at some of these next.
But first a caveat. To find very subtle differences between two such subgroups, say women and men, and effects of this illness on activity levels, a more robust number of respondents than n=98 may be necessary. That's a plug for getting the questionnaire into more hands of those with this illness. And the word of caution serves to remind that subtle differences may get exactly reversed when "n" has increased substantially.
That said, statistical control of these results is possible already, and where clear differences are already discovered to be significant, those may persist with larger numbers as well. And the results already suggest some quite interesting possibilities, as seen further below.
First, some less proounced differences.
What about gender?
90.82% of respondents are female, so 9.18% male. What levels of activity compared with "usual"?
Female: 52.1% Male: 51.1% One guesses at "no difference." Once can compare means ...
Female: 2.604±1.138, n = 91 with Male: 2.556±0.831, n = 9. The answer takes the form of a probability that this slight increase in activity level among women, is different than that for the 9 men respondents. p=0.9023, and that means that 90 times out of 100, that 1% apparent difference just isn't real.
Conclusion: men and women are equally impacted in activity levels by this illness.
What about age?
Those respondents <= to age 49 years, (n=47) have an activity level result of 51.1%
Thos older than 49 years (n=53) "score" 52.8% of usual activity level. Answer? Nope. A value of p=0.6906 informs that this slight difference is probably imaginary 69 times out of 100 times that you would gather the data.
Yes, one finds subgroups of age that seem more or less affected. The differences are too small to be important on this date. But with another 5000 respondents, who knows?
Conclusion: those of all ages are equally impacted in activity levels by this illness. Of course, as presented above, this is a moderate illness for most. If only those critically ill had answered, age might become a quite important determinant of activity level. Here, those data are absent.
What about weight? Does a person's size, reflected in the Body Mass Index, make a difference in activity levels when compared with usual activity?
92 of the 98 with useful answers provided Height, Weight Before, and Weight on the day they responded. Once different units had been converted to metric, that looked like this:

Weight changes and perhaps related to a direct effect of the virus on adipocytes (fat cells) have been covered before in another article. In fact two articles. We see here that 45.7% of those who responded, gained weight. But what about a possible effect of body size and changes in size, on activity levels?
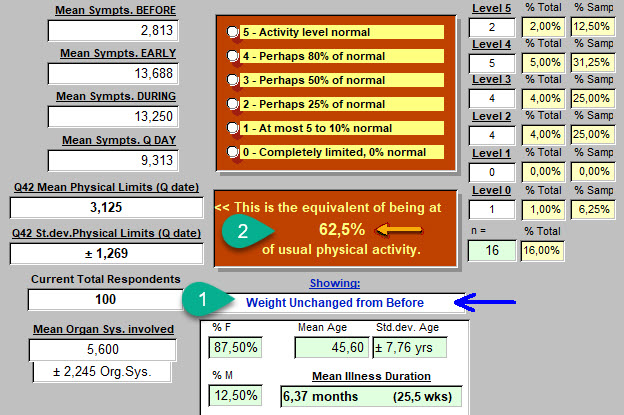
Here are those who serve in some sense as controls: no change in weight while sick.
Lots of other numbers on this image, but concentrate on point 1 below: "Weight unchanged from before." and point 2: 62.5% of normal activity level. So that's better (a bit closer to normal) than the average we saw at the top of this page (51.2%).
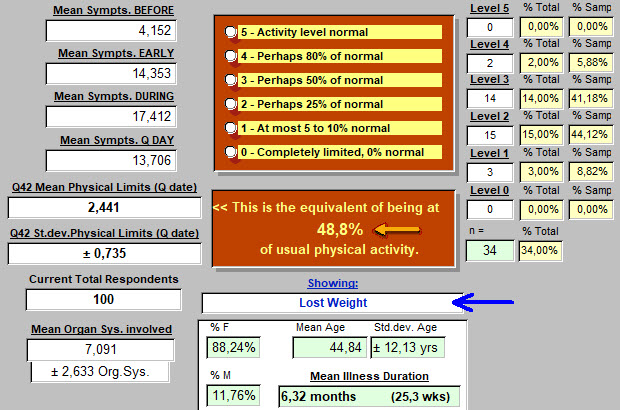
Those who lost weight while ill: 48.8% of usual activity level.
Is this a different result than for those who's weight did not change?
The null hypothesis is that there is no difference in these activity levels.
Answer is: p = 0.0197, so this hypothesis of "no difference" is not sustained. About 2 chances in 100 tries that we'd come up with a different conclusion.
Conclusion: Weight loss during this illness is accompanied by a significant reduction in activity level, when compared with those who's weight remained unchanged during the illness.
Those who gained weight while ill: 47.8% of usual activity level.

Is this a different result than for those who's weight did not change?
The null hypothesis is that there is no difference in these activity levels.
Answer is: p = 0.0321, so this hypothesis of "no difference" is not sustained. About 3 chances in 100 tries that we'd come up with a different conclusion.
Conclusion: Weight gain during this illness is accompanied by a significant reduction in activity level, when compared with those who's weight remained unchanged during the illness.
Let's quickly pass over other possibilities related to weight or more accurately, Body Mass, and possible effects on level of activity when compared with usual levels before illness.
Again, where the differences are subtle, as more respondents add to replies, the conclusion may in fact become reversed, even if usually more certain. Preliminary results are presented here at a point in time. Many will be close to the mean value for limitation of physical activity by this illness. Others, may be a bit more remarkable.
| Before vs on Questnr. date | Percent of Usual Physical Activity | Number of respondents (n) |
| Those Underweight and still are | 46.7% | 3 |
| Obese before | 47.2% | 25 |
| Class 3 Obese before & still | 30.0% | 4 |
| Obese before but no longer | 40% | 6 |
| Not obese before, became so | 40% | 3 |
| Not Overweight, became so | 60% | 7 |
What about other components of health status, that might have some link to how well physical activity levels are maintained?
What about smoking?
In the UK, 14.7% of the population smokes. That figure in the United Sates is 13.7% (2019 figures).
In our sample of 100 respondents on October 7, 46 have a smoking history. That is of course 46%.
So what might one think about the potential effect of a history of smoking on physical activity levels when one is now ill with "long-term" COVID-19? Is there any effect at all?
Here are the results from this sample. On this day, with 100 respondents each number, 'n' , is also the percentage:
| Smoking History | Percent of Usual Physical Activity | Number of respondents (n) |
| Never smoked | 47.8% | 54 |
| Those who smoked | 57.0% | 46 |
|
Moderate smokers |
58.3% | 24 |
| Heavy smokers | 54.3% | 21 |
| Women, never smoked | 47.5% | 48 |
| Women, smokers | 55.6% | 41 |
| Men, never smoked | 44.0% | 5 |
| Men, smokers | 60.0% | 4 |
It looks like, if one is a non-smoker, one should quickly take up the habit in support of improved physical activity levels !
Let's put some to the test. Using their means and standard deviations:
Non-smokers: 2.389±1.145, n=54
All Smokers : 2.848±1.021, n=46
The test is Student's t-test, unpaired, two-tailed.
The null hypothesis is that their is no difference in physical activity levels of these subgroups of "long-term" COVID-19 patients.
Result: t = 2.0991 df = 98 standard error of difference = 0.219 p = 0.0384
Conclusion: the null hypothesis of no difference is rejected. Smokers with this illness maintain a level of physical activity that is closer to their baseline, and superior to non-smokers.
For Moderate Smokers, also essentially true. 2.917±1.077, n=24, p=0.0595
For Heavy Smokers, less true, 2.714±0.933, n=21, p=0.2505, so not a significant difference.
Women, Never Smoked: 2.375±1.148, n=48
Women, +ve Smoking Hx: 2.780±1.024, n=41
Null hypothesis: no difference in mean level of limitation of physical activity, based on smoking or not in these female respondents presenting with "long-term" COVID-19.
Result: t = 1.7428 df = 87 standard error of difference = 0.232 p = 0.0849 (close but no cigar).
9 chances in 100 tries that there is no difference. Some would still bet on their being a difference.
As more respond, the conclusion may change.
Men, Never Smoked: 2.200±0.980, n=5
Men, Men, Smokers: 3.000±0.001, n=4
Results for these very small subgroups, p=0.1515
Positive Health Habits
In presenting observed effects of body size and smoking on physical activity levels of respondents, one introduces a related topic: doing what one can to maintain one's health. Maintaining a normal weight. Not smoking, or quitting.
What else might one choose to do in support of one's health?
And do such choices specifically impact how well physical activity is preserved when, unfortunately, one is ill with "long-term" COVID-19?
We'll look first at respondents who took any form of Nutritional Supplement.
And subsequently: Vitamin-D is again "in the News." This time for protecting against and perhaps for treating respiratory problems of COVID-19. How were respondent Serum Vit-D levels before becoming sick? How much Vitamin-D were they taking before? We'll look at that as well. All of this couched in terms of effects on effectiveness of reducing physical limitations during this illness.
Of course, results of pursuing such information might be expected to be quite different in a population of respondents who are competitive athletes, and a group presenting chronic health problems.
So how "healthy" was our group of 100 respondents before they became ill?
Question 31 of the questionnaire provides that answer:

So the majority (46%) presented through their choice, a status typical for age. Athletes, only 6%. Twenty-three percent selected "perfect health," and 20% with 1 important health problem before catching COVID-19.
Nutritional Supplements
Did respondents take these, and what was the impact on Physical Activity Limitations on the day they responded to the questionnaire?
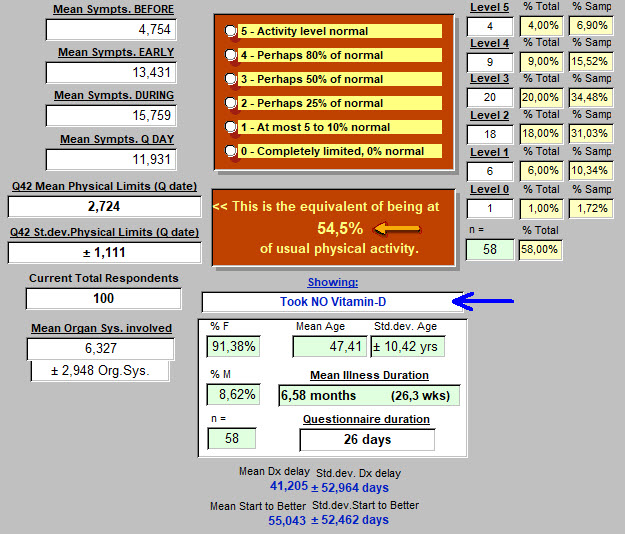
Here below, lots of numbers. So stay focused on those two in the middle with the arrows ...

Those who took No Nutritional Supplements, 42 respondents, had an average physical activity level at 58.6% of their usual level on the day they took the questionnaire.
How about those who responded that they took some form of nutritional supplement? That might be one multivitamin each day, or some added protein, or some Vitamin-D of varying doses, or several vitamins and supplements each day. For this response, all are equated with taking a nutritional supplement.
Again, for the question at hand, focus on the arrows in the middle.

Those who took ANY Nutritional Supplements, 51 respondents, had an average physical activity level at 47.1% of their usual level on the day they took the questionnaire.
"Oh No! More people take nutritional supplements than don't, and they did worse!"
If that is the hypothesis, is it true?
Or is it actually that no difference exists in mean physical activity limitation level of these two groups?
Answer is: The two-tailed P value equals 0.0129 The idea of no difference is rejected.
Conclusion: Those (42) presenting with "long-term" COVID-19 who reported taking No Nutritional Supplements at all, maintained a higher level of their usual physical activity, than those (51) who took Any Supplement. Possibility that this conclusion is wrong? 13 chances in 1000 trials.
Vitamin - D Supplements
Since we are still hearing that Vitamin-D may play a protective role against respiratory complications of COVID-19, might taking that supplement routinely before getting sick, also impact on Physical Activity Levels?
Here below, no one took supplemental Vitamin-D.
And here below, respondents took Vit-D, but less than 1000 IU per day:
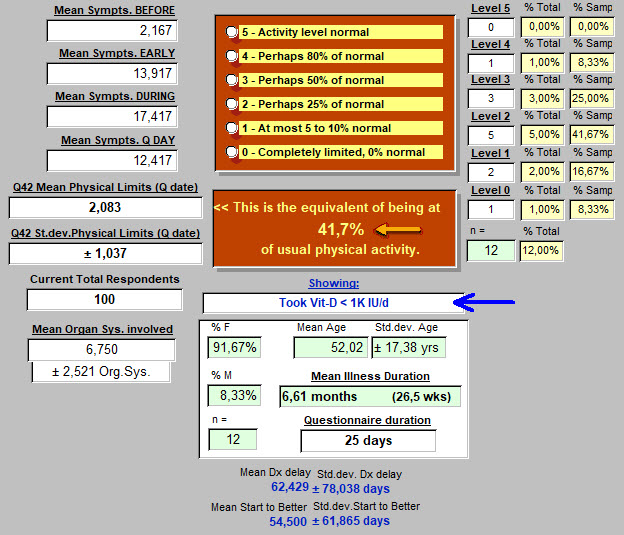
And finally, respondents taking between 1000 and 5000 IU Vitamin-D each day:

Results:
- Those (58) taking no Vitamin-D seemed to better maintain physical activity than those (12) taking low doses of less than 1000 IU per day. The two-tailed P value equals 0.0704. Almost a significant difference at the usual p<0.05 level. So probably already suggesting something that will become more apparent with more respondents who take small doses of the vitamin.
- For those taking larger (1000 to 5000 or more IU of Vit-D per day), compared with those taking none, the two-tailed P value equals 0.4686. This means that no difference was found in the physical activity levels of these two groups, no Vit-D vs. higher dose Vit-D.
- Comparing level of limitation of physical activity of the low dose (12) vs. higher dose Vit-D (16): The two-tailed P value equals 0.2923. So 29 chances out of 100 that any apparent difference arose by chance.
This is not saying that taking supplemental Vitamin-D serves no purpose. But as related to level of physical activity limitation due to "long-term" COVID-19, no beneficial effect was discovered so far in these preliminary results.
How about measured blood levels of Vit-D? They may be a better gauge of how much Vitamin-D is getting into the body. Of those responding, how many had serum Vitamin-D levels that were below normal, and how many at or above normal? And to keep focus for this article, were there significant differences in levels of limitation of physical activity associated with these blood levels of this specific supplement?
Results:
- Serum Vit-D reported as below normal (n=10), and at or above normal (n=5). Those below normal maintained an average of 56% of activity while those at normal and above averaged 40%. The two-tailed P value equals 0.0966. By conventional criteria, this difference is considered to be not quite statistically significant. But with these small group sizes no conclusion should be drawn at this point. Why would a higher Vitamin-D blood level be detrimental to physical activity?! Doesn't fit with what is already well established in the medical literature about this substance.
----------
A final comparison may reveal some intriguing aspects of this illness that emerge from these preliminary results of our questionnaire.
Some respondents provided no date when they were diagnosed with COVID-19.
Some respondents have had no positive tests confirming COVID-19.
Other respondents provided a date when told that they "had COVID-19" and at least one positive test. Many had several positive tests.
So how do these groups compare in level of limitation in Physical Activity?
First, those with a date of diagnosis (Dx) and at least 1 positive test for COVID-19.
They are at an average of 49.2% of usual physical activity.
Again, on the image below, we are focusing on the two central points with arrows:

And below, those who provided no Date of Diagnosis and not a single positive test (including physical exam alone) : average Physical Actvity level - 58.2% of normal.

Staying focused on Physical Activity Level, the null hypothesis says that there is no difference in this level for these two subgroups of our 100 respondents.
Dx date & +'ve test: 2.462±1.028, n = 52.
No Dx date or +'ve test: 2.909±1.124, n = 22.
t = 1.6629 df = 72 The two-tailed P value equals 0.1007. Or, 10 chances out of 100 that there is no difference. Probably on to something. Are those with No Date of Diagnosis, and No Positive Test, and who seem to be doing better physically after the same duration of illness, ... just making it all up? Probably not. But this may be defining a subgroup or variant of the COVID-19 illness. Or perhaps, they have a completely different illness? Fungal disease, such as Aspergillosis comes to mind.
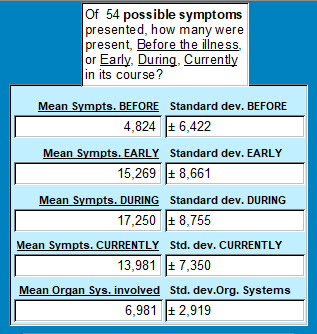
If one compares average number of symptoms reported Before, Early in illness, During the illness and on the day of the Questionnaire, here are the values for those WITH a Date of Diagnosis and Test Pos. :
90.38% female, 9.62% male, age 49.38±10.56 years, ill 24.6 weeks.
And for those WITHOUT a Dx Date and no positive test :
81.82% female, 18.18% male, age 48.76±12.62 years, ill on average, 27.9 weeks.
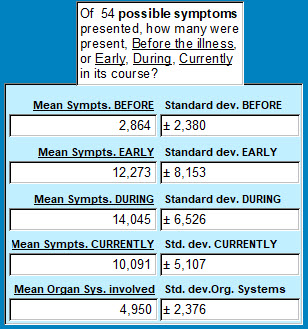
Simply put, those with no Dx Date nor a Pos. Test report fewer symptoms throughout the course of this illness, and even Before the illness began.
BEFORE: The two-tailed P value equals 0.1697
EARLY: The two-tailed P value equals 0.1709
DURING: The two-tailed P value equals 0.1273
CURRENTLY: The two-tailed P value equals 0.0270**
Organ Systems Involved : The two-tailed P value equals 0.0052***
Results: reported symptom count before, early in the illness, and throughout the illness, though seemingly higher in the group with Dx Date and Pos. Test(s) were not statistically different from the other group who provided no Date of Dx nor any positive test results.
But at the time the questionnaire was completed, the number of symptoms was now different and higher in the group with Dx Date and Pos. Test(s). Only 3 chances in 100 that this apparent difference was not real.
The apparent difference in the reported count for Organ Systems involved (on average, 6.98 vs 4.95) is even more significant. Five chances in 1000 that this apparent difference arose by chance or error.
----------
CONCLUSIONS :
-
- "Long-term" COVID-19 patients have a significantly limited level of physical activity when compared with pre-illness levels. Essentially, cut in half.
- To obtain these results, nothing was objectively measured here, other than the respondent's subjective opinion. Of course, if someone reported taking a dose of 5000 IU of Vitamin D, it was accepted as an objectively true and accurate response. Being objective and accurate about one's activity level may be a bit more difficult. We did not measure hand grip strength or number of pushups at 4 different times.
- This level is at approximately 50% of where they were before becoming ill. That requires time and resilience to adapt to. On a scale of 0 to 5 for resilience, these 100 respondents averaged 3.521±1.216. This was between the two responses of: "Don't know yet. Scared and stuck on many days. Always hopeful. Not resilient yet." (value 2) and "I usually bounce back, but this was a blow. I do feel I'm slowly recovering some resilience." (value 3). Resilience was explored in Question 56, and has been addressed in a separate article.
- Certain factors in place before developing the "long-term" COVID-19 illness are also determinant of this limitation of activity level.
- those who were underweight, and
- those who were Class III obese have more problems with physical activity limitations
- smokers may have less physical activity limitations than non-smokers. Not intuitive, but probably true. Prompts a search for explanation(s).
- Taking supplements (before becoming ill with COVID-19), either in a general form like "multi-vitamins" or specifically, Vitamine-D, did not contribute to maintaining a higher level of Physical Activity while still ill with "long-term" COVID-19, when compared with normal Physical Activity levels for each respondent before becoming ill.
- The subset of respondents (22, or 22% at this time) who provided no Date of Diagnosis of COVID-19, and no positive tests to support this diagnosis is interesting. They have fewer symptoms than the paired group with positive diagnostic results. This is only supported statistically at the time when they responded to the questionnaire. Yet, they have many symptoms as well. At the time of taking the questionnaire, they clearly have fewer symptoms. And the number of organ systems involved is certainly less. As demonstrated, the limitation of Physical Activity is less in this group lacking the usual diagnostic information. Explanation? None that is clear. Are they less ill than the group supplying diagnostic information? Probably. A higher percentage of males, though still mostly female as in the other group. They are also further along in the duration of the illness when they responded. Are they just closer to "being better"? Does this explain fewer symptoms? Not for those times identified as Before, Early, and During. Are they a variant of this "long-term" COVID-19? Possibly.
Closing thoughts:
Frequently, the respiratory and less commonly the cardiovascular systems are involved with COVID-19.
A pulse oximeter on a finger is a commonly presented image.
Smokers are inflicting upon themselves, a chronic level of hypoxemia, and from that, tissue hypoxia.
Their tissues become more adept at extracting oxygen from hemoglobin, and living in a somewhat desaturated condition.
In those with pre-existing obesity, meeting tissue oxygen demands is also a chronic problem. It is challenged by routine physical activity each day when climbing stairs for example.
So in fact, these two subgroups presented here represent a state of chronic relative tissue hypoxia.
It is somewhat akin to living at higher altitudes. Initially challenging but eventually leading to physiologic changes to avoid having hypoxemia (reduced O2 levels in the blood) become tissue hypoxia (reduced levels of O2 at a cellular level).
One might consider these both as a form of training for the oxygen-related deficits seen in COVID-19.
As odd as that sounds, those who never smoked are not chronically on the borderline of tissue hypoxia. Those who were not carrying around excess weight, had no reason to make physiologic adjustments to assure adequate oxygen delivery. Then the oxygen delivery problems associated with this viral illness came into play. And without "prior training." More effects that lean towards limitation of physical activity.
Those at the extreme ends of underweight or overweight, have a marked limitation of physical activity imposed by this illness.
Nutritional supplements seemed to have contributed little or nothing to maintaining physical activity capabilities. In fact, the opposite, a negative effect on physical activity was suggested. This is a perfect opportunity to draw no conclusions until more responses are obtained.
Clearly, presenting an average of 50% of usual physical activity for the overall group of 100 respondents at this point in the review, is thought provoking. At first pass, normal physical activity levels depend on intact cardiovascular and respiratory systems, functioning in concert. But the end-organs of all that oxygen and nutrient delivery are the muscles, brain, and other tissues and organs working in a synergy that we referred to or group as "physical activity."
If 50% of these patients had "a serious heart problem," by now, that would be known. Yes, some present a myocarditis (heart cell inflammation) but most of these are severely or critically ill. Or on the Pathologist's table. So rather than being so targetted, even if one adds back the lungs, a much more global effect on the body as a whole is suggested. Pathologists have already provided many findings distributed throughout the body's organs and tissues that are consistent with this finding in our 100 respondents on this date. And their huge number of symptoms early and during this illness, are again consistent with path and clinical findings. Fortunately, and as they responded, they are suffering an illness of moderate severity. (Not very convenient to take a questionnaire when being mechanically ventilated).
"Healthcare," with its ever-creasing tendency towards hyper-specialization, is not often prepared to do anything with such a symptom list but dismiss it. Or one step less ineffective, to focus in on only one or two items from the list. That can quickly lead to trouble, and on both sides of the exam table.
Targetting each area of organ (or tissue) involvement with specific diagnostic tests to prove presence or absence, and specific therapies aimed at curing or at least improving abnormal findings, sounds like a daunting task and certainly is!
So one must not forget in this less than perfectly clear clinical setting, that with time and basic support, the body tends toward healing itself. Unless a body has strayed so far, through illness or habits, from Walter B. Cannon's "homeostasis" or middle of the road, it usually finds its way back.
Anyone suffering with this illness should find much hope in that.
<<<<<<< Questionnaire answers - start here
(this is where several previous "Lessons" are posted).
This was Lesson 8: How much does "Long-term" COVID-19 impact one's usual activity level?
<<<<<<< Introduction to the Questionnaire
<<<<<<<<< Take the Questionnaire
<<<<<<<<<<< Home page
A découvrir aussi
- Lesson 3: Effective emotional support - where shall we turn?
- Lesson 5: Fostering resilience
- Lesson 6: Impact of "Long-term" COVID-19 on Quality of Life perceptions